
Introduction
Imagine standing on the precipice of a digital gold rush. Bitcoin, the pioneering cryptocurrency, continues to captivate the world with its volatile yet promising trajectory. As of June 17, 2025, Bitcoin finds itself in a complex web of technical indicators and market sentiments. This report will navigate through the current state of Bitcoin, providing a clear and engaging analysis of the technical landscape, market dynamics, and potential future scenarios.
The Technical Landscape
Consolidation and Support Levels
Bitcoin is currently in a consolidation phase within an ascending triangle pattern. This pattern is characterized by a horizontal resistance level and an upward sloping support trendline. The price is trading above both the support trendline and the Ichimoku Cloud, which is acting as additional support. This phase is crucial as it sets the stage for the next directional move. A solid breakout above the resistance level could signal a bullish trend, while a breakdown below the support trendline could indicate a bearish reversal.
The ascending triangle pattern is a classic setup in technical analysis, often seen as a continuation pattern. The horizontal resistance level represents a psychological barrier for traders, while the upward sloping support trendline indicates a series of higher lows. This pattern suggests that buyers are becoming more aggressive, but they are still facing resistance at a certain price level.
Short-Term Bearish Momentum
On shorter timeframes, the momentum indicators are painting a bearish picture. The Moving Average Convergence Divergence (MACD) shows a bearish crossover on the 5-minute chart, indicating short-term selling pressure. Similarly, the Relative Strength Index (RSI) is oversold on the 1-hour and 6-hour charts, suggesting that the price may be due for a bounce. However, the bearish momentum is persistent across multiple timeframes, which could indicate a deeper correction.
The MACD is a popular momentum indicator that shows the relationship between two moving averages of a security’s price. A bearish crossover occurs when the MACD line crosses below the signal line, indicating that the security may be overbought and due for a correction. The RSI, on the other hand, measures the speed and change of price movements. An RSI below 30 is typically considered oversold, suggesting that the price may rebound.
Fibonacci Retracement Levels
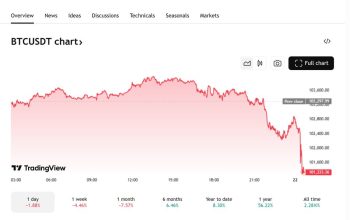
Bitcoin is testing the 0.786 Fibonacci retracement level near $103,000. This level is significant as it often acts as a strong support or resistance zone. If Bitcoin can reclaim the $106,000 level, it has the potential for a bullish breakout toward $117,565. However, a breakdown below $102,703 could negate this setup and lead to further downside movement.
Fibonacci retracement levels are based on the Fibonacci sequence, a series of numbers in which each number is the sum of the two preceding ones. In technical analysis, these levels are used to identify potential support and resistance levels. The 0.786 level is particularly important as it often acts as a strong support or resistance zone.
Market Sentiment and External Factors
Institutional Interest
Despite the technical indicators, there is strong institutional interest in Bitcoin. Institutional investors often view Bitcoin as a hedge against inflation and a store of value, similar to gold. This interest can provide a floor for the price, even during periods of technical weakness. The current geopolitical tensions in the Middle East have not significantly impacted Bitcoin’s price action, indicating that institutional investors are maintaining their positions.
Institutional interest in Bitcoin has been growing steadily over the years. Major financial institutions and hedge funds have been allocating a portion of their portfolios to Bitcoin, viewing it as a digital gold. This institutional interest can provide a floor for the price, even during periods of technical weakness.
Astrological Influences
Some analysts also consider astrological factors in their market analysis. For instance, the Mars/Venus opposition on June 17, 2025, was noted as a potential source of volatility. While astrology is not a traditional tool in financial analysis, it can provide additional insights into market sentiment and potential turning points.
Astrology has been used for centuries to predict market movements. Some analysts believe that the alignment of planets can influence market sentiment and potential turning points. For instance, the Mars/Venus opposition is often associated with increased volatility and uncertainty.
The Road Ahead
Potential Scenarios
In this scenario, Bitcoin would break above the horizontal resistance level of the ascending triangle, signaling a bullish trend. The strong institutional interest and the potential for a bullish flag pattern on higher timeframes would support this move.
In this scenario, Bitcoin would break below the upward sloping support trendline of the ascending triangle, signaling a bearish trend. The bearish momentum on shorter timeframes and the potential for a deeper correction would support this move.
Key Levels to Watch
– Support: $102,703, $103,000 (0.786 Fib retracement)
– Resistance: $106,000, $117,565 (bullish target)
– Key Indicators: MACD, RSI, Ichimoku Cloud, Fibonacci retracement levels
These key levels and indicators will play a pivotal role in shaping Bitcoin’s future trajectory. Traders should keep a close eye on these levels and indicators to make informed trading decisions.
Conclusion: Navigating the Uncertainty
Bitcoin’s current technical landscape is a mix of consolidation, bearish momentum, and strong institutional support. As investors navigate this uncertainty, it is crucial to stay informed and adaptable. The next directional move will likely be confirmed by a breakout or breakdown from the ascending triangle pattern. Whether Bitcoin continues its bullish trend or enters a deeper correction, the key levels and indicators discussed will play a pivotal role in shaping its future trajectory. Stay vigilant, stay informed, and most importantly, stay adaptable in the ever-changing world of cryptocurrency.