The Current State of Bitcoin
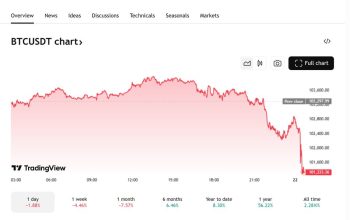
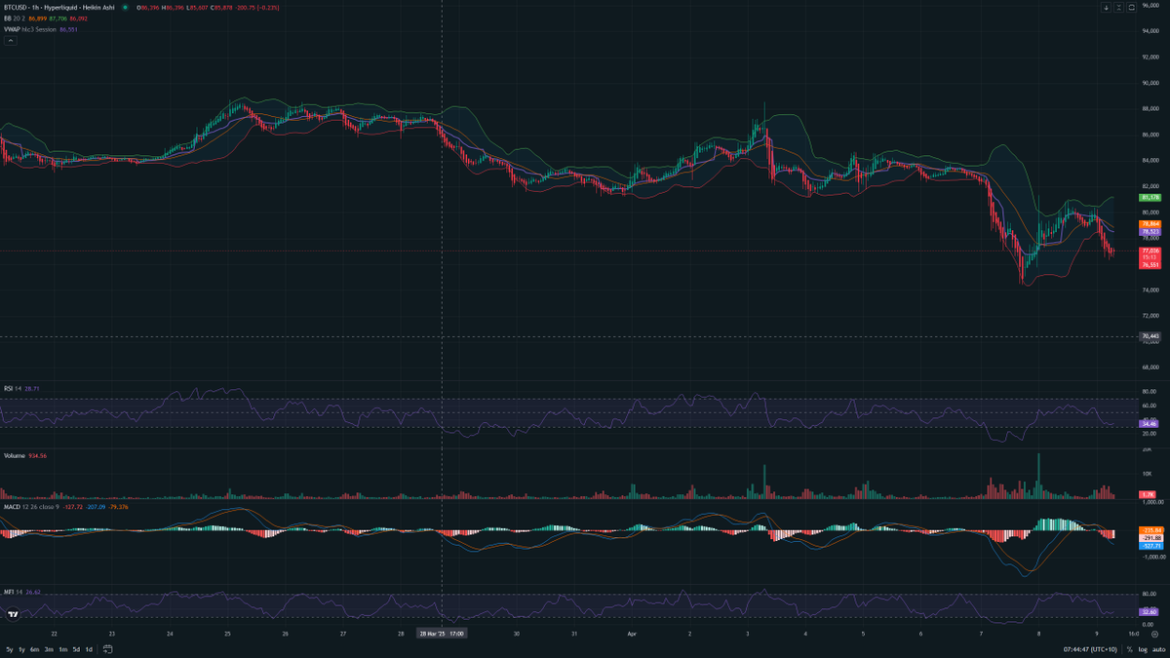
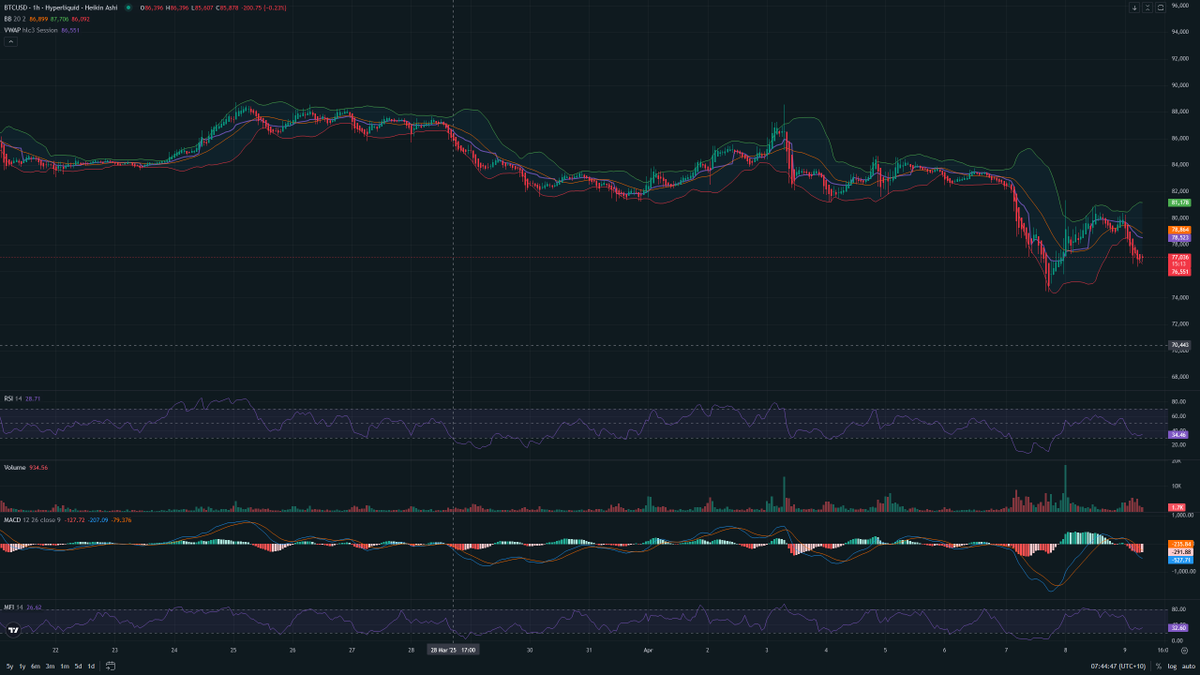
Imagine standing at the edge of a cliff, looking down at the tumultuous sea below. That’s the feeling many Bitcoin investors are experiencing today. The cryptocurrency giant is in the midst of a strong downtrend, with the Relative Strength Index (RSI) oversold at 28 and the Moving Average Convergence Divergence (MACD) indicating a bearish cross. Support is holding at $77,500, with resistance at $80,000. Short entries are being considered at $78,300, with a stop loss at $79,500 and a target of $76,500. The market is a battleground, and Bitcoin is currently on the defensive.
Technical Analysis: The Bearish Perspective
The Death Cross and Other Omens
A wave of concern has swept through Bitcoin investors due to the looming “death cross,” a technical signal often seen as predicting price drops. This phenomenon occurs when a short-term moving average crosses below a long-term moving average, signaling a bearish trend. However, CoinShares’ latest analysis calls these worries unfounded. The crypto asset management firm argues that the death cross is not as dire as it seems, and that Bitcoin’s fundamentals remain strong. But the market is a fickle beast, and technical indicators can often sway investor sentiment.
The death cross is a classic technical indicator that has historically been a reliable predictor of market downturns. However, it’s not foolproof. Market conditions can change rapidly, and what seems like a clear signal today might not hold true tomorrow. For instance, during the 2018 bear market, the death cross appeared multiple times, but Bitcoin managed to recover each time. This historical context is crucial for understanding the current market dynamics.
The Role of Global Money Supply
Research shows a correlation between the global M2 money supply and Bitcoin’s price, backing the analysis of many market observers. Historical patterns and current data (with the M2 money supply at $90.219 trillion USD and Bitcoin at $79,000) suggest that a rally is plausible. However, markets are complex, and fractal predictions are not certain. The relationship between money supply and Bitcoin price is just one piece of the puzzle.
The global money supply is a critical factor in understanding Bitcoin’s price movements. When central banks increase the money supply, it can lead to inflation, which often drives investors towards alternative assets like Bitcoin. Conversely, a decrease in the money supply can lead to deflationary pressures, making Bitcoin less attractive. Understanding these dynamics is essential for predicting future price movements.
The Broader Market Context
Macro Conditions and Recession Fears
Macro conditions and recession fears are finally materializing, something that has been warned about since 2021. These broader economic factors can have a significant impact on Bitcoin’s price, as investors seek safe havens during times of uncertainty. The current bearish trend in Bitcoin could be a reflection of these macroeconomic concerns.
Recession fears are a significant driver of market sentiment. When economic indicators point towards a potential recession, investors often flock to safe-haven assets like gold and government bonds. Bitcoin, while volatile, is also seen as a store of value by many investors. Understanding the broader economic context is crucial for predicting Bitcoin’s price movements.
The Altcoin Season and Bitcoin’s Role
The altcoin season is in full swing, with many investors turning their attention away from Bitcoin and towards alternative cryptocurrencies. This shift in focus can often lead to a decrease in Bitcoin’s price, as investors sell their holdings to invest in other projects. However, it’s important to remember that Bitcoin remains the king of cryptocurrencies, and its price movements can often set the tone for the rest of the market.
The altcoin season is a cyclical phenomenon in the cryptocurrency market. During these periods, investors often look for the next big thing, leading to a surge in the prices of alternative cryptocurrencies. However, this can often come at the expense of Bitcoin, as investors reallocate their portfolios. Understanding these cycles is essential for navigating the market.
The Impact of Technical Indicators
The RSI and MACD: Friends or Foes?
The RSI and MACD are two of the most widely used technical indicators in the cryptocurrency market. The RSI measures the speed and change of price movements, while the MACD is a trend-following momentum indicator. In the current market, the RSI is oversold at 28, while the MACD is indicating a bearish cross. These indicators suggest that Bitcoin’s price could continue to fall in the short term.
Technical indicators are powerful tools for predicting market movements, but they are not infallible. The RSI and MACD are just two of many indicators that traders use to make decisions. It’s essential to consider multiple indicators and market factors when making investment decisions.
The Role of Support and Resistance Levels
Support and resistance levels are another crucial aspect of technical analysis. In the current market, support is holding at $77,500, with resistance at $80,000. These levels can often act as barriers to price movements, with support levels preventing further declines and resistance levels preventing further gains. In the current bearish trend, these levels are crucial to watch, as a break below support could signal further declines.
Support and resistance levels are critical for understanding market dynamics. These levels are often psychological barriers that can influence investor behavior. For example, if a significant number of investors have set their stop-loss orders at a particular price, that level can act as a support or resistance point. Understanding these dynamics is essential for predicting future price movements.
The Future of Bitcoin: A Glimmer of Hope
The Potential for a Rally
Despite the current bearish trend, there is still potential for a rally in Bitcoin’s price. The correlation between the global M2 money supply and Bitcoin’s price suggests that a rally is plausible, and historical patterns support this view. However, it’s important to remember that markets are complex, and fractal predictions are not certain.
The potential for a rally is always present in the cryptocurrency market. Historical patterns and market dynamics suggest that Bitcoin’s price could rebound. However, it’s essential to remain cautious and consider multiple factors when making investment decisions.
The Role of Investor Sentiment
Investor sentiment plays a crucial role in the cryptocurrency market, and the current bearish trend could be a reflection of negative sentiment. However, sentiment can change quickly, and a shift in investor outlook could lead to a rally in Bitcoin’s price. It’s important for investors to stay informed and adapt to changing market conditions.
Investor sentiment is a powerful driver of market movements. Positive sentiment can lead to a rally, while negative sentiment can lead to a downturn. Understanding and adapting to changing market sentiment is essential for successful investing.
Conclusion: Navigating the Bearish Trend
In the end, the bearish trend in Bitcoin is a reflection of the complex and ever-changing nature of the cryptocurrency market. Technical indicators, macroeconomic factors, and investor sentiment all play a role in shaping Bitcoin’s price movements. As investors, it’s crucial to stay informed, adapt to changing market conditions, and remain vigilant in the face of uncertainty. The cliff may be steep, but with the right tools and mindset, investors can navigate the tumultuous sea below and emerge stronger on the other side.
Sources