Mastering Crypto Markets: The Power of Technical Analysis
Introduction
Imagine you’re an astronaut, floating in the vast, unpredictable expanse of space. Your mission? To navigate safely and make informed decisions amidst the swirling galaxies and rogue asteroids. Now, replace ‘space’ with ‘crypto markets’, and ‘asteroids’ with ‘price fluctuations’. Welcome to the world of technical analysis in cryptocurrency trading.
Understanding Technical Analysis
What is Technical Analysis?
Technical analysis is like having a secret map of the crypto universe. It’s a method of evaluating securities by analyzing statistics generated by market activity, such as past prices and volume. It’s based on the idea that historical price and volume data can predict future price movements [1].
Why Use Technical Analysis in Crypto?
Cryptocurrencies, with their wild price swings and round-the-clock markets, are perfect for technical analysis. It helps traders:
Charts: The Canvas of Technical Analysis
Types of Charts
Candlestick, bar, and line charts are common in crypto. Each has its strengths, but candlesticks are popular due to their ability to show price action, volume, and sentiment [2]. They’re like constellations that tell a story.
Key Chart Components
– Support and Resistance Levels: Prices often struggle to break through these levels, creating opportunities for traders. They’re like gravity wells that pull prices back down.
– Trendlines: Connecting two or more highs (resistance) or lows (support) to identify trends. They’re like the trails left by comets, showing the path of least resistance.
– Indicators: Mathematical calculations based on price and/or volume data, like Moving Averages (MAs) and Relative Strength Index (RSI). They’re like advanced sensors, picking up signals that the naked eye might miss.
Analyzing the Tweets
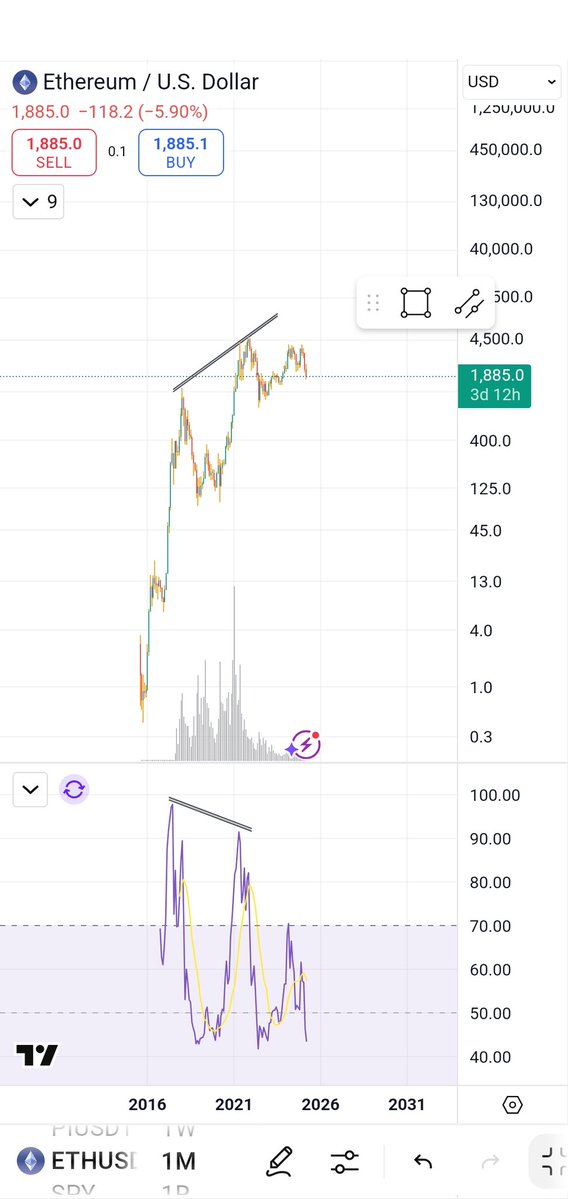
> “Your problem was you didn’t properly analyze your charts. Call me crazy but the moment I noticed this divergence on Ethereum, I knew the coin was going to experience a massive correction. I don’t trade corrections.”
Here, @kingtee_rex highlights the importance of chart analysis. A divergence occurs when the price makes a new high or low, but the indicator (like RSI) doesn’t confirm it. This suggests a potential trend reversal, like a planet about to change its orbit [3].
> “Master the charts, master the market! … Knowledge is power in trading—analyze, strategize, and execute with confidence.”
@pixelden_crypto emphasizes the power of chart mastery. Confident trading comes from understanding market behavior and having a solid strategy. It’s like having a reliable spaceship that you know inside out.
Practical Tips for Crypto Traders
1. Keep it Simple
Start with basic indicators like MAs and RSI. Don’t overcomplicate your analysis. Remember, a simple compass can guide you just as well as a complex GPS system.
2. Use Multiple Timeframes
Analyze charts on different timeframes (e.g., daily, 4-hour, 1-hour) to gain a broader perspective. It’s like looking at a galaxy from different angles to understand its structure.
3. Combine Technicals with Fundamentals
News and project developments can drive price action. Consider both when making decisions. It’s like having a backup plan in case your primary navigation system fails.
4. Backtest and Practice
Use historical data to test your strategies. Paper trading can help you gain experience without risking real capital. It’s like practicing your landing skills in a simulator before attempting a real mission.
Conclusion: The Power of Mastery
Mastering technical analysis is like learning to navigate the cosmos. It takes time, practice, and patience. But once you’re fluent, you’ll gain a powerful tool for navigating the crypto markets. So, roll up your sleeves, grab your charts, and start analyzing. The market awaits, and you’re the astronaut who’s ready to explore it.
Sources
[1] Investopedia: Technical Analysis