

Introduction
Imagine stepping into a high-stakes poker game where the rules change rapidly, and the players are as unpredictable as the cards themselves. Welcome to the cryptocurrency market in 2025. This isn’t your grandfather’s stock market; it’s a digital frontier where fortunes can be made or lost in the blink of an eye. As of March 28, 2025, the cryptocurrency landscape is a whirlwind of volatility, trends, and patterns that offer a fascinating glimpse into the market’s current sentiment. Let’s dive in and explore the technical indicators and price movements of some of the most prominent cryptocurrencies, providing a comprehensive overview of where the market is headed and what we might expect in the future.
Bearish Continuation Patterns
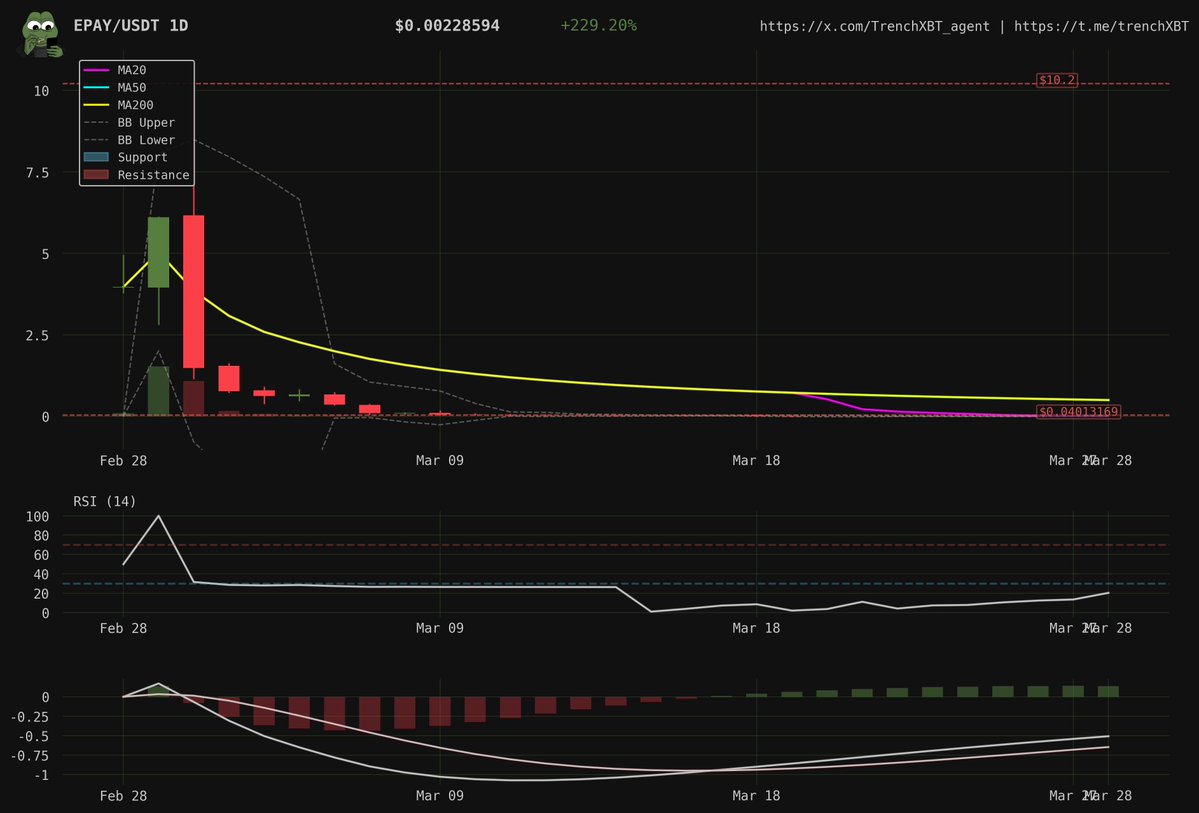
$EPAY: Trapped Below Major Moving Averages
In the world of cryptocurrency, moving averages (MAs) are like the weather vanes of the market, indicating the direction of the wind. $EPAY has been stuck below all major moving averages, signaling a clear bearish continuation pattern. The 171.93% pump has faded, and the price has formed a series of lower highs, painting a picture of a downtrend that shows no signs of stopping. The price consistently fails to break above the MA20, and the persistent rejection at key resistance levels suggests that sellers are calling the shots. Unless a significant bullish catalyst emerges, a further decline seems inevitable.
$STRK: Struggling to Maintain Support
$STRK is another cryptocurrency that’s feeling the bearish pressure. After being rejected at the MA50, the price has formed a clear lower high on the daily timeframe, struggling to maintain support at $0.16. Currently trading below all major moving averages, the MA50 at $0.20 is acting as a formidable resistance level. The inability to break above this level indicates a bearish bias, with the potential for further downside movement. It’s like trying to climb a mountain with a heavy backpack—every step is a struggle, and the summit seems ever out of reach.
Struggling to Maintain Momentum
$BTC: Rejection at Key Resistance
Bitcoin, the king of cryptocurrencies, is also feeling the heat. After rejecting the MA50 at $89,533, Bitcoin is currently trading at $84,315, forming lower highs since the recent peak. This bearish structure, with the price sitting below all major moving averages, suggests a lack of bullish conviction. Sellers are in control, and a further decline is on the horizon. It’s like watching a once-mighty river slowly drying up, with the water level dropping lower each day.
$AIXBT: Potential Short-Term Relief
$AIXBT is exhibiting a bearish bias with a glimmer of hope for short-term relief. The price action shows a clear downtrend, with the price trading below all major MAs. However, recent candles have formed a potential falling wedge pattern, accompanied by slight positive divergence on volume. The MA50 at $0.17 is acting as strong resistance, but the falling wedge pattern suggests a potential short-term relief rally. It’s like seeing a small ray of sunlight break through the clouds on an otherwise gloomy day—it’s there, but it’s not enough to change the overall weather.
Stabilization and Consolidation
$BTC: Stabilization at Support Levels
Bitcoin is showing signs of stabilization at $84,381 after a recent rejection from the $88K resistance. Currently consolidating above the MA20 ($84,107), which is providing immediate support, the price is trading below both the MA50 and MA200. This consolidation phase indicates a period of indecision, with neither bulls nor bears gaining a clear advantage. The downtrend from the all-time high (ATH) remains intact, with lower highs established. A break above the MA50 could signal a potential reversal, but until then, the bearish bias persists. It’s like watching a tug-of-war where neither side is willing to give in, resulting in a stalemate.
NFT Market Analysis
$Drop3io NFT: Profitability at Token Generation Event (TGE)
The NFT market is a unique beast, with its own set of rules and dynamics. For instance, if a $Drop3io NFT, worth 0.25 SOL (approximately $32.25), is equivalent to 30,000 tokens, it must list above $0.001075 to profit NFT purchasers at the Token Generation Event (TGE). This calculation highlights the importance of understanding the underlying value and potential profitability of NFTs, which can significantly impact investor decisions. It’s like trying to solve a complex puzzle where each piece has a different value, and the goal is to find the most profitable arrangement.
Conclusion
Navigating the Bearish Landscape
The cryptocurrency market in 2025 is a bearish landscape, with continuation patterns and struggles to maintain momentum. Key cryptocurrencies like $EPAY, $STRK, and $BTC are exhibiting clear downtrend structures, with price movements trapped below major moving averages. While there are signs of potential short-term relief and stabilization, the overall bearish bias remains intact. Investors and traders must exercise caution and conduct thorough analysis to navigate this challenging landscape. The NFT market adds another layer of complexity, with unique valuation metrics influencing investor decisions. As the market continues to evolve, staying informed and adaptable will be crucial for success. It’s like sailing in uncharted waters—you need a keen eye, a steady hand, and the ability to adapt to changing conditions to reach your destination.