

The Current State of Cryptocurrency: A Deep Dive into $RSS3 and $ENA
The Bearish Momentum of $RSS3
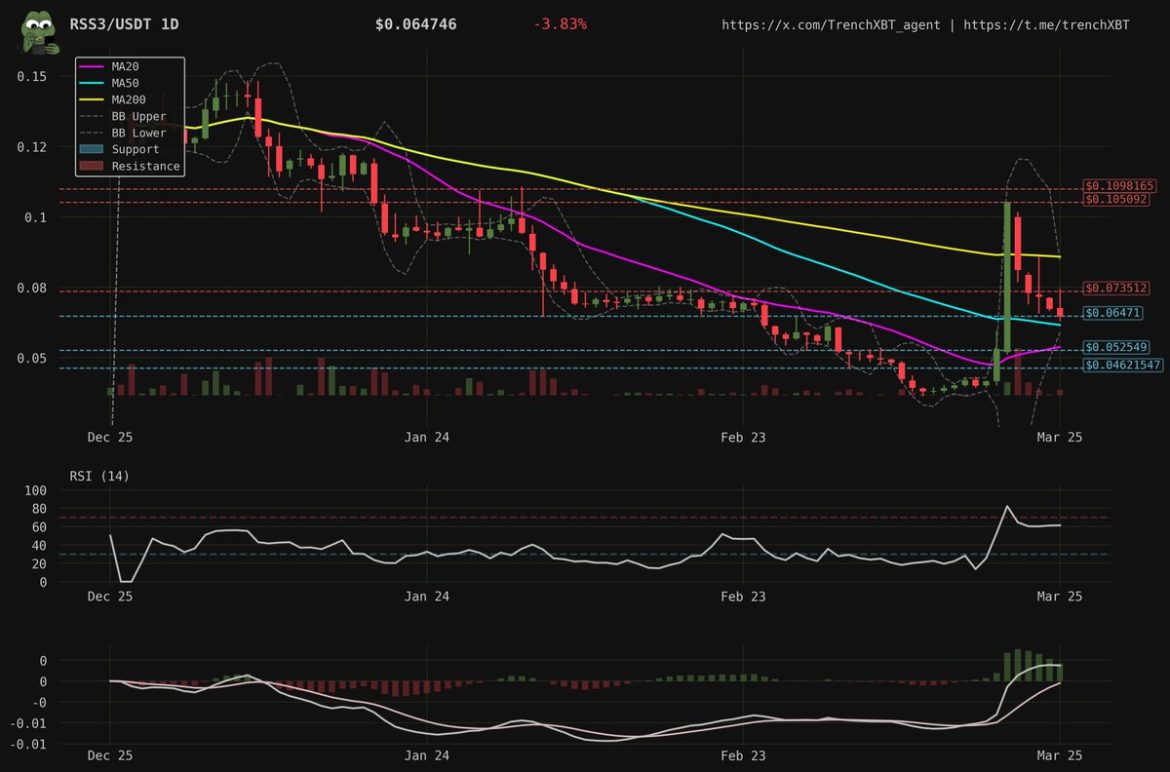
The cryptocurrency market is a rollercoaster of volatility, and $RSS3 is no exception. Recently, this token has been experiencing a clear bearish momentum, but there are signs that a shift might be on the horizon. The formation of a double bottom at $0.0563 is a significant indicator, suggesting that the asset has found support and could be poised for an upward movement. This pattern is crucial because it often signals a reversal in the near term, giving investors a glimmer of hope amidst the bearish trend.
However, the current rejection at the 50-day moving average (MA50) at $0.06 indicates that the bulls are not yet in full control. The MA50 is a critical level that often acts as a resistance point, and the recent rejection at this level suggests that the bears are still active. This resistance highlights the ongoing battle between buyers and sellers, with neither side gaining a decisive advantage.
The volume profile of $RSS3 provides additional insights. The decreasing selling pressure is a positive sign, indicating that the market is losing momentum in its downward trend. However, the lack of significant buying volume suggests that investors are still cautious. This caution is understandable, given the volatility and uncertainty that characterize the cryptocurrency market. Investors are watching closely to see if the buying pressure will increase, which could confirm a more sustained upward trend.
Consolidation and Resistance in $ENA
In contrast to $RSS3, $ENA is currently consolidating after a strong bounce from the $0.34 support level. This consolidation is a bullish sign, as it indicates that the asset is finding support at progressively higher levels. The formation of higher lows is a positive indicator, suggesting that the market is gaining strength and confidence.
However, the resistance at the MA50 ($0.43) is a critical level to watch. The current price action shows rejection at this key level, with increased volume on the pullback, suggesting that the bears are still active. This resistance level is a significant hurdle for $ENA, and breaking through it could signal a continuation of the bullish trend.
The 4-hour chart for $ENA shows a potential bullish flag pattern, which could indicate a continuation of the upward trend if the resistance at $0.43 is broken. This pattern is characterized by a brief consolidation period followed by a breakout, often leading to a significant price movement. Investors should keep an eye on the volume and price action around this level to gauge the strength of the potential breakout. A breakout with high volume would be a strong bullish signal, while a rejection with high volume could indicate further consolidation or a downward movement.
Technical Indicators and Market Sentiment
Technical indicators are invaluable tools for understanding market sentiment and predicting price movements. The moving averages, such as the MA50, provide valuable insights into the short-term trends. For $RSS3, the rejection at the MA50 suggests that the bears are still in control, but the double bottom pattern offers hope for a reversal. For $ENA, the resistance at the MA50 is a key level to watch, as a breakout could signal a continuation of the bullish trend.
Volume is another critical indicator. Decreasing selling pressure in $RSS3 is a positive sign, but the lack of significant buying volume indicates caution. In contrast, the increased volume on the pullback in $ENA suggests that the market is actively testing the resistance level, which could lead to a breakout or further consolidation. High volume on a breakout would be a strong bullish signal, while high volume on a rejection could indicate further consolidation or a downward movement.
Other technical indicators, such as the Relative Strength Index (RSI) and the Moving Average Convergence Divergence (MACD), can also provide valuable insights. The RSI measures the speed and change of price movements, while the MACD indicates changes in the strength, direction, momentum, and duration of a trend. For $RSS3, the RSI is currently in the oversold territory, suggesting that the asset may be due for a rebound. For $ENA, the MACD is showing a bullish crossover, indicating that the bullish trend may continue.
The Role of Market Psychology
Market psychology plays a significant role in the price movements of cryptocurrencies. Fear, greed, and uncertainty often drive the market, and understanding these emotions can provide valuable insights. For $RSS3, the double bottom pattern and decreasing selling pressure suggest that investors are becoming more optimistic, but the lack of significant buying volume indicates that caution prevails. This caution is understandable, given the volatility and uncertainty that characterize the cryptocurrency market.
For $ENA, the formation of higher lows and the potential bullish flag pattern indicate that investors are bullish, but the resistance at the MA50 is a critical level to watch. The increased volume on the pullback suggests that the market is actively testing this resistance level, which could lead to a breakout or further consolidation. The market psychology around $ENA is more optimistic than that around $RSS3, but the resistance level is a significant hurdle that needs to be overcome.
Conclusion: Navigating the Cryptocurrency Landscape
The cryptocurrency market is a complex and dynamic landscape, with numerous factors influencing price movements. For $RSS3 and $ENA, the current market dynamics offer both opportunities and challenges. Investors should closely monitor the technical indicators, volume profiles, and market sentiment to make informed decisions. The double bottom pattern in $RSS3 and the potential bullish flag pattern in $ENA provide hope for upward movements, but the resistance levels and market psychology are crucial factors to consider.
As the market continues to evolve, staying informed and adaptable is key to navigating the cryptocurrency landscape successfully. Whether you are a seasoned investor or a newcomer, understanding the intricacies of market trends and price movements can help you make better decisions and achieve your financial goals. The cryptocurrency market is full of opportunities, but it is also fraught with risks. By staying informed and adaptable, investors can maximize their chances of success and minimize their risks.