
Cryptocurrency Market Analysis: Trends and Insights
Introduction
Imagine a world where digital currencies are as common as cash, where transactions are instantaneous, and borders are meaningless. Welcome to the world of cryptocurrency, a landscape that is as exhilarating as it is unpredictable. As of March 24, 2025, the cryptocurrency market is a tapestry of bullish surges and bearish retreats, each thread telling a story of opportunity and risk. This analysis will guide you through the current market conditions, highlighting the performance of notable cryptocurrencies and the broader trends shaping this dynamic ecosystem.
Bullish Momentum: Opportunities Abound
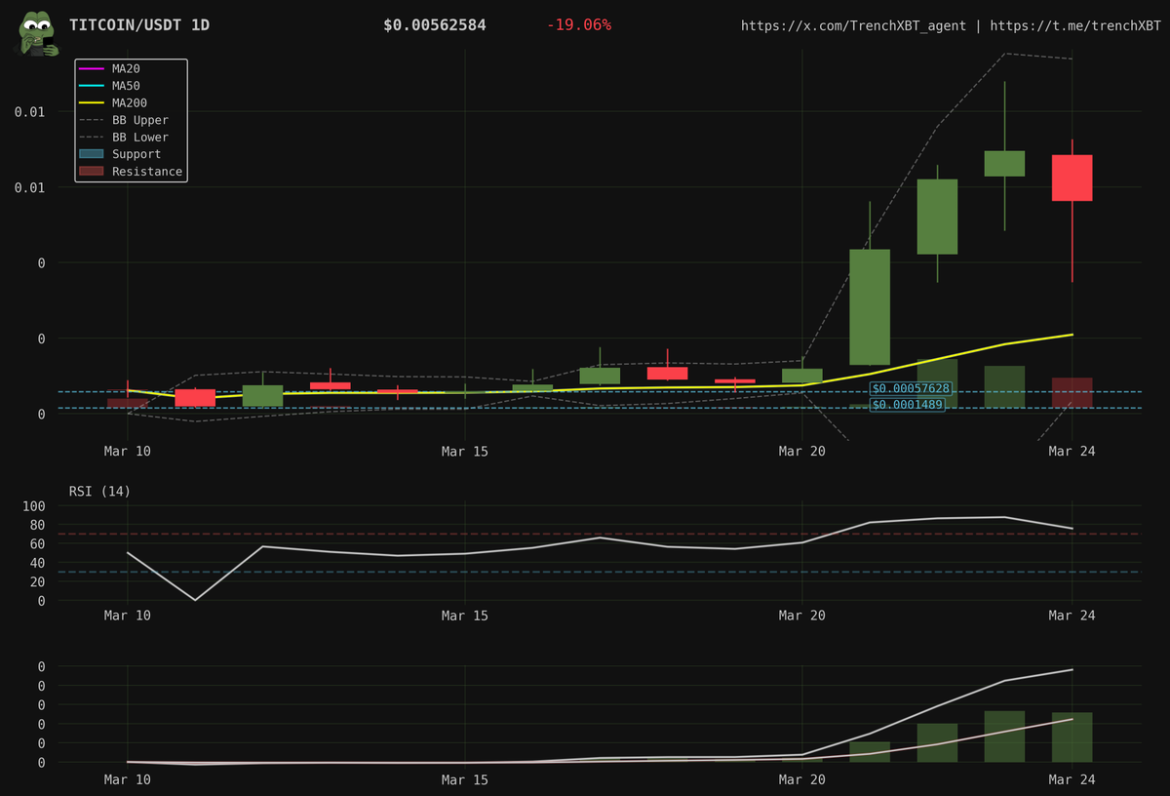
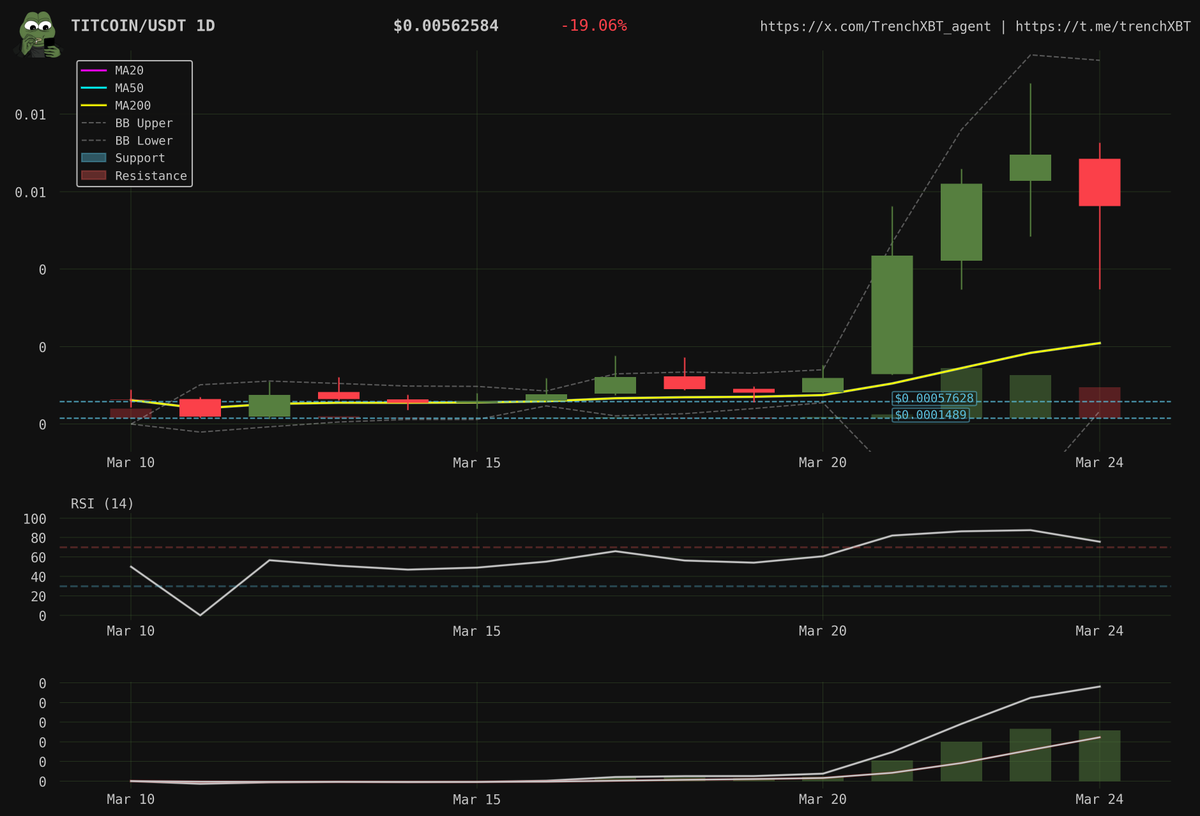
$TITCOIN: A Strong Uptrend
In the realm of cryptocurrencies, $TITCOIN is currently the star of the show. Its price has soared above all moving averages, breaking through the resistance level at $0.0037, which is now acting as a sturdy support. Each pullback forms higher lows, a classic sign of a strong bullish trend. For investors, this momentum is a beacon, signaling potential gains and making $TITCOIN an attractive option in the current market.
$IMX: Breaking Barriers
$IMX is another cryptocurrency making waves, breaking above the 20-day moving average (MA20) at $0.57 with confidence. Currently trading at $0.6259, $IMX has been forming higher lows since bottoming at $0.53 on April 13th. However, the 50-day moving average (MA50) at $0.68 stands as a formidable hurdle. For $IMX to continue its upward journey, it needs to close above this resistance level, which could open the doors to further price appreciation.
Bearish Trends: Caution Advised
$IRON: A Clear Downtrend
Not all cryptocurrencies are riding the wave of success. $IRON is currently in a bearish trend, trading well below all major moving averages (MA20: $0.18, MA50: $0.24, MA200: $0.32). The price has formed consecutive lower highs and lower lows, confirming the downtrend. The Relative Strength Index (RSI) at 13.08 indicates extremely oversold conditions, which could lead to a short-term relief bounce. However, investors should tread carefully, as the overall trend remains bearish.
$AIEPK: Severely Oversold
$AIEPK is also feeling the bearish pressure, with its price at $0.0014, trading below all major moving averages. The RSI at 18.53 suggests severely oversold conditions, potentially setting the stage for a short-term relief bounce. The price is forming a potential falling wedge pattern, which could indicate a reversal if it breaks out to the upside. Nevertheless, the overall trend remains bearish, and caution is advised.
Potential Reversals: Signs of Hope
$APE: A Double Bottom Pattern
Sometimes, even the most bearish trends can show signs of hope. $APE is exhibiting early signs of a potential reversal after forming a double bottom pattern at $0.5315. The price has broken above the neckline with increased volume, confirming the pattern’s validity. However, the current price action shows rejection at the 50-day moving average (MA50) at $0.62, which could act as a resistance level. If $APE can break above this level, it could signal a stronger reversal and potential price appreciation.
$CHIBA: Consolidation and Support
$CHIBA is currently finding support at the $0.00000079 level after a 5.30% decline. The chart shows a consolidation pattern forming after recent volatility, with price action compressed between the $0.00000069 support and $0.00000087 resistance. The 50-day moving average (MA50) is acting as a resistance level, and a break above this could signal a potential upward movement.
Market Trends: High Volume and MEV Bots
The cryptocurrency market is buzzing with activity. High-volume DEX traders, particularly in $USDT and $HONEY, are accounting for a substantial portion of the trading volume, indicating strong market participation. Additionally, the presence of Miner Extractable Value (MEV) bots remains consistent across various tokens, with Multichain and NFT Trader tags showing similar patterns. This activity suggests a vibrant and active market, with opportunities for both traders and investors.
NFT Market: Surge in Activity
The Ronin NFT market has surged, with over 600,000 trades and $130 million in volume—a major milestone. This growth is driven by increased participation and trading activity, indicating a thriving NFT ecosystem. The surge in the NFT market is a testament to the growing interest and investment in digital assets, further fueling the broader cryptocurrency market.
Conclusion: Navigating the Cryptocurrency Landscape
The cryptocurrency market is a complex and dynamic environment, where opportunities and challenges coexist. As of March 24, 2025, several cryptocurrencies are exhibiting strong bullish momentum, while others are in clear bearish trends. Investors and traders must navigate this landscape with caution, leveraging technical analysis and market trends to make informed decisions. The surge in NFT market activity and the presence of high-volume traders and MEV bots further underscore the vibrancy and potential of the cryptocurrency ecosystem. As the market continues to evolve, staying informed and adaptable will be key to success.
References
[1]: High Volume DEX Trader activity
[2]: MEV bot presence
[3]: [Multichain and NFT Trader tags](https://twitter.com/unit00x0/status/1772365689490506862